貸借対照表(B/S)損益計算書(P/L)利益とキャッシュフロー(C/F)の比較Excel
Balance Sheet (B/S) Income Statement (P/L) Profit vs. Cash Flow (C/F) Excel
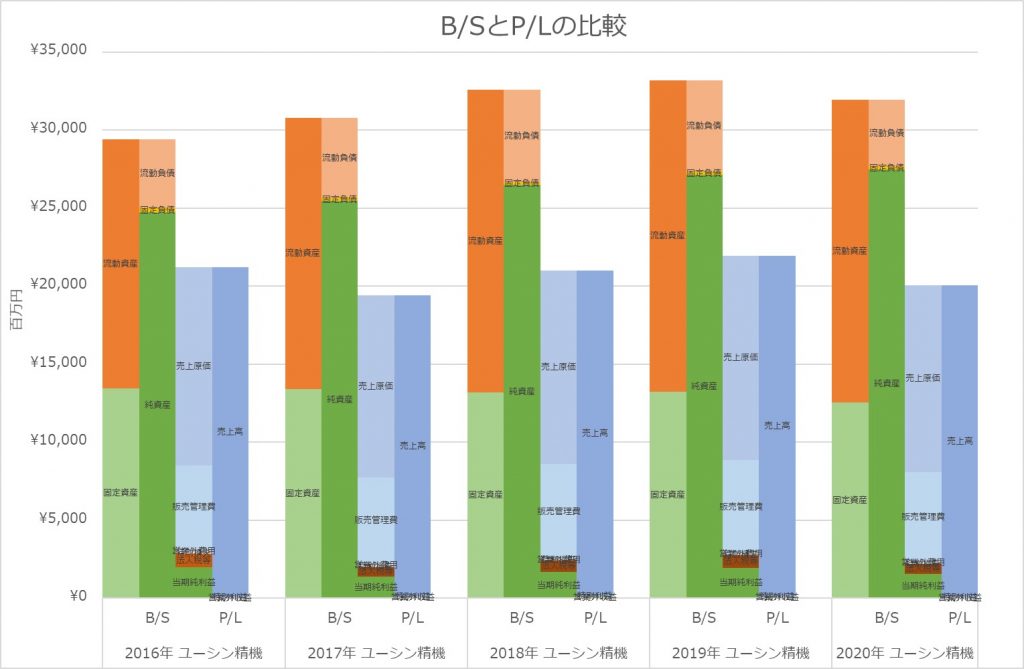
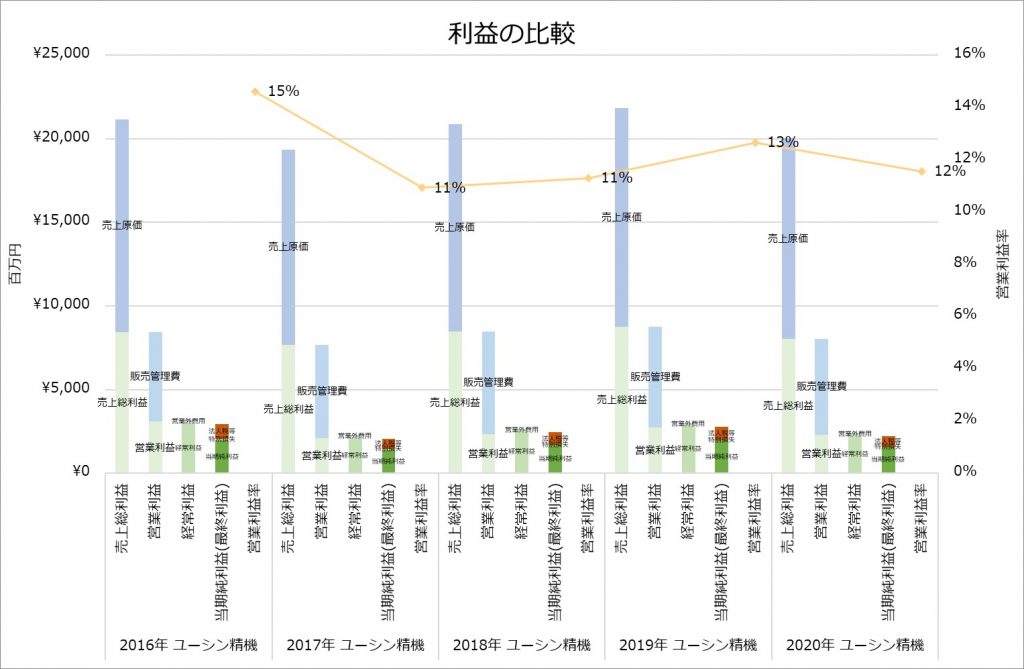
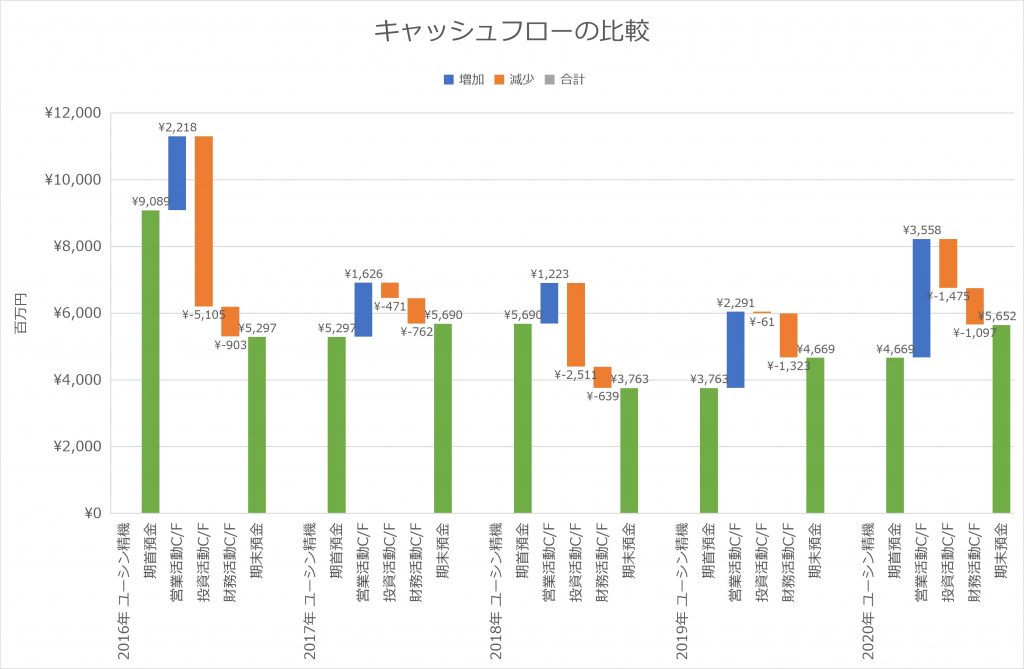
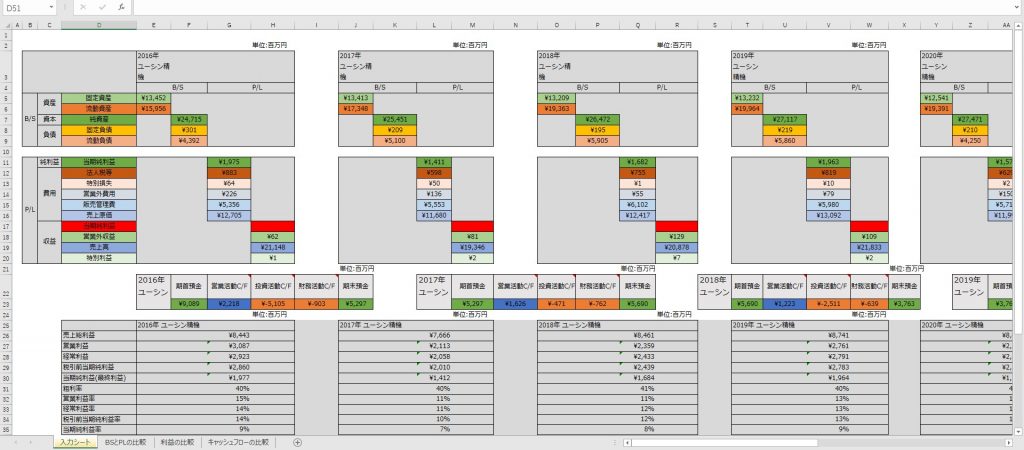
以下のExcelファイルは、以前書いた記事、貸借対照表(B/S)損益計算書(P/L)キャッシュフロー(C/F)のグラフ化Excelから内容を更新した、貸借対照表(B/S)と損益計算書(P/L)と利益とキャッシュフロー(C/F)をグラフ化するためのExcelファイルです。ダウンロードして使って頂けると嬉しいです。
Excel file for graphing balance sheet (B/S), profit and loss statement (P/L), profit and cash flow (C/F). I would be happy if you could download and use them.
エクセルの入力シートのタブに、有価証券報告書から拾ってきた、固定資産や流動資産、売上高や販売管理費、の期首預金や営業活動C/Fなどの数値を入力して行くと、以下のグラフを作成することができます。
The following graphs can be created by entering the figures for fixed assets, current assets, sales, SG&A expenses, opening deposits, and C/F of operating activities from the financial reports in the tabs of the input sheet in Excel.
